For Job Seekers
Where is employment improving? (Data May 2012 to May 2013)
Map Title: 12-month change in unemployment rates by State, not seasonally adjusted Map Type: state Map Month/Year: May/2013 | |||
| State | May 2012 |
May 2013 |
12-month net change |
| Alabama | 7.1 | 6.3 | -0.8 |
|---|---|---|---|
| Alaska | 6.9 | 6.0 | -0.9 |
| Arizona | 8.2 | 7.4 | -0.8 |
| Arkansas | 7.1 | 7.3 | 0.2 |
| California | 10.3 | 8.1 | -2.2 |
| Colorado | 7.9 | 6.8 | -1.1 |
| Connecticut | 8.3 | 8.1 | -0.2 |
| Delaware | 6.7 | 6.9 | 0.2 |
| District of Columbia | 9.0 | 8.3 | -0.7 |
| Florida | 8.6 | 7.0 | -1.6 |
| Georgia | 8.9 | 8.5 | -0.4 |
| Hawaii | 5.9 | 4.5 | -1.4 |
| Idaho | 6.8 | 5.9 | -0.9 |
| Illinois | 8.5 | 8.7 | 0.2 |
| Indiana | 8.1 | 8.1 | 0.0 |
| Iowa | 4.9 | 4.3 | -0.6 |
| Kansas | 5.6 | 5.8 | 0.2 |
| Kentucky | 8.1 | 8.3 | 0.2 |
| Louisiana | 6.5 | 7.0 | 0.5 |
| Maine | 7.3 | 6.8 | -0.5 |
| Maryland | 6.7 | 6.9 | 0.2 |
| Massachusetts | 6.5 | 6.8 | 0.3 |
| Michigan | 8.9 | 8.4 | -0.5 |
| Minnesota | 5.3 | 4.9 | -0.4 |
| Mississippi | 9.1 | 9.2 | 0.1 |
| Missouri | 6.7 | 6.7 | 0.0 |
| Montana | 5.7 | 4.9 | -0.8 |
| Nebraska | 3.8 | 3.8 | 0.0 |
| Nevada | 11.2 | 9.2 | -2.0 |
| New Hampshire | 5.3 | 5.1 | -0.2 |
| New Jersey | 9.3 | 8.7 | -0.6 |
| New Mexico | 6.7 | 6.4 | -0.3 |
| New York | 8.4 | 7.4 | -1.0 |
| North Carolina | 9.3 | 8.9 | -0.4 |
| North Dakota | 2.7 | 2.8 | 0.1 |
| Ohio | 6.8 | 6.9 | 0.1 |
| Oklahoma | 5.1 | 5.3 | 0.2 |
| Oregon | 8.4 | 7.6 | -0.8 |
| Pennsylvania | 7.7 | 7.4 | -0.3 |
| Rhode Island | 10.3 | 9.2 | -1.1 |
| South Carolina | 9.0 | 7.8 | -1.2 |
| South Dakota | 4.2 | 3.8 | -0.4 |
| Tennessee | 7.9 | 8.3 | 0.4 |
| Texas | 6.8 | 6.5 | -0.3 |
| Utah | 5.7 | 4.6 | -1.1 |
| Vermont | 4.7 | 4.2 | -0.5 |
| Virginia | 5.8 | 5.6 | -0.2 |
| Washington | 8.3 | 6.6 | -1.7 |
| West Virginia | 7.3 | 5.9 | -1.4 |
| Wisconsin | 6.7 | 6.7 | 0.0 |
| Wyoming | 5.3 | 4.2 | -1.1 |
Sector Performance
Job growth has been slow with only 195,000 nonfarm payroll jobs added in June. The National unemployment rate remained at 7.6%, but underemployment jumped mainly due to seasonal influences. Generally the economy is going sideways. Lets look at some of the important sectors of the economy.The Leisure and Hospitality sector accounts for a third of the June jobs. Most of those jobs are in "food services and drinking places." Good news for entry level employees and immigrants affected by the new amnesty bill before the U.S. Congress.
Retail trade was another area of job growth, along with health care, financial activities and business and professional services. America's future increasingly depends on gains in the mining sector.
Specifically, we point to oil and gas mining as a key area of strength at this time.
Some sectors of the economy are suffering. Construction and manufacturing have not recovered significantly since the Democrat Congress of 2007 pushed the economy over the cliff.
Employment Details
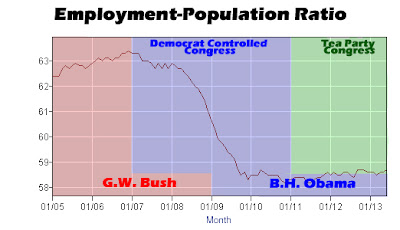
President Obama has failing numbers in Employment-Population Ratio. The number of people employed as a percentage of the U.S. Population has fallen and it can't get up. While the number for June 2013 rose .1%, the average for the year is the same as the average of 2012. There has been no improvement since the number fell drastically beginning in January 2007. As Democrats took control of the U.S. Congress in 2007 the number began to plummet from 63.3% to the current 58.6%.
To add to the economic injury, the civilian labor force is really taking a beating under the Obama administration. Between ObamaCare and executive branch over-reach, even the Tea Party Congress has has not been able to instill confidence in the civilian labor force.
Immigration
Another employment factoid is "Immigrants account for all job gains since 2000: native-born workers’ employment has fallen" per the Washington Times.
The Center for Immigration Studies report, which is being released Wednesday, says 22.4 million immigrants (both legal and illegal) of working age held jobs at the beginning of this year, up 5.3 million over the total in 2000. But native-born workers with jobs dropped 1.3 million over that same period, from 114.8 million to 113.5 million.When we consider that many of the growing economic sectors are lower-wage, this immigration (both legal and illegal) factoid might account for some of the spiraling civilian labor force participation. If illegal immigrants are taking jobs they are likely "under the table" and not counted in official reports.
Conclusions
The U.S. economy is shaky at best. It seems unlikely that interest rates will spike for the foreseeable future. Until all the uncertainty surrounding the current administration clears, it is hard to imagine a full recovery.
There are a couple other interesting pieces of employment data on the BLS.GOV:
There are a couple other interesting pieces of employment data on the BLS.GOV:


