Tuesday, July 30, 2013

$4 Gas Returns as More Americans Face Poverty

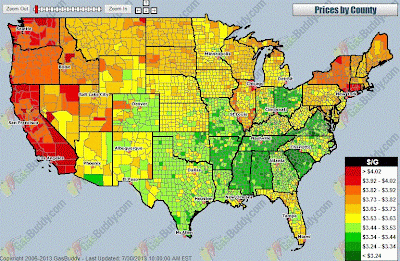
Gas Price Heat Map
Click Here for Interactive Map

San Diego gas prices have climbed over $4 per gallon. Prices have risen from $3.56 in December to the current $4.01 per GasBuddy.com. This price is slightly down from a week ago, but uncertainty exists as this year has been very quiet in regard to summer storms. All this is occurring while 80% of Americans face poverty (by 2030 per AP) and the U.S. economy deteriorates.

(note: the 80% is "if current trends continue" which they never do.)

San Diego Gas Prices
Click Here for Interactive Chart

High gas prices aren't a sexy topic anymore. Since George W. Bush has left office, the national news seldom reports the high gas prices so here is the information. South Carolina has the lowest prices in the country at $3.281, the national average today is $3.645 and Hawaii leads prices at $4.335. Crude oil prices have dropped over $5 per barrel since hitting $108 on July 19, and currently are holding around $103 per barrel.

San Diego Residents can find slight relief by examining this map of prices by area zip codes.

San Diego Gas Price Heat Map
Click Here for Interactive Map
The President refuses to open up key oil pipelines from Canada, the administration hinders domestic oil production in favor of expensive green energy, ObamaCare is stifling employment and Dodd-Frank is hindering the financial sectors. Still, "Progressives" misdirect blame to Republicans for the economic collapse of 2008, despite the fact Democrats took control of Congress in 2007 and began a war on the economy.

Democrats Cause 2008 Economic Collapse


Lets review how high gas prices affect the economy.

In 2007 the real estate market was weak. The housing market had inflated to the maximum through government programs which created a market for people who could not actually afford homes. These people struggled under their new inflated mortgages but other aspects of the Bush economy looked pretty good. The national media was on an economic fear campaign driven by Democrat talking points for the 2006 mid-term election and the housing bubble was obvious but the mechanism to pop the housing bubble was not clear.

The Democratic victory in the 2006 congressional elections signaled a lot to the U.S. economy. President Bush could maybe veto some insanity, but business was put on notice. Green Energy to fight the mythical scourge of global warming, minimum wage cost increases to price more consumers out of the job market, increased taxes to support government dependency spending, irresponsible handling of U.S. debt and more threatened the private economy.

The biggest threat to the economy was the fact that it had been stumbling but like a tired yet tough fighter it remained on its feet. Still, the Democrats had controlled the political narrative with outright lies and prevailed. If a new political genie had been released, some of the dumbest politicians in the country had wishes to be fulfilled. What would be next?!? Uncertainty is the biggest threat to an economy.

Immediately, the 2007 congress restricted business lobbyists, increased minimum wages, increased taxes and, in June, H.R. 6  began an global warming inspired assault on the energy sector:
Motion to Concur in the Amendment of the House to the Amendment of the Senate to the Text of H.R. 6, with an Amendment; A bill to reduce our Nation's dependency on foreign oil by investing in clean, renewable, and alternative energy resources, promoting new emerging energy technologies, developing greater efficiency, and creating a Strategic Energy Efficiency and Renewables Reserve to invest in alternative energy, and for other purposes.
 Bayh Amdt. No. 1508; To provide for the publication and implementation of an action plan to reduce the quantity of oil used annually in the United States.
America had stood against the global warming alarmists, but this signaled a change in policy direction. It seemed that "Global Warming" was the political genie which would destroy the U.S. Economy. Markets faltered, gas prices increased, and consumer good's prices increased due to higher transportation costs. Average Americans could no longer afford the fuel for their vacations and the money misdirected towards gasoline made it tougher for people to pay their unaffordable mortgages. Foreclosures formed an economic tidal wave.
In January 2007, the price of gasoline averaged $2.11 per gallon in the U.S. On February 7, 2007, the Democrats and the 110th Congress began enacting policies. Upon implementation of Democrat economic and political policy the price of gasoline skyrocketed.
By July 2008, the price of gasoline had reached $4.12 and the economy collapsed.
Since 2008 America has printed lots of money, so the value of 2013 $4 gas is significantly less than 2008 $4 gas. However, we are approaching a dangerous threshold. Adjustable rate mortgages (ARMs) come in 1, 3, 5 and 7 year terms. Since the collapse of housing prices in 2008-2009, we have seen waves of foreclosures related to these mortgages. Due to timing, a wave of 7 year ARM related mortgage defaults may be occurring now. The question is whether housing prices have increased enough to allow these people to refinance.  If not, high gas prices might be the final financial straw for many of our fellow Americans.

In the words of sarcastic teen internet meme, Thanks Obama.

Tuesday, July 23, 2013

Birthdate, ObamaCare and Information Privacy

There is an old saying among gentlemen that goes, "never ask a woman her age." In the age of Big Data, here is a new nugget of genderless common sense for everyone: "Never give your Birthdate, EVER." When you give someone your birthdate, sex and zip code they can identify you. If they combine this information with publicly available data, they can identify you by name.

A website called How Unique Are You shows precisely how. The website was created to alert you to the dangers to your privacy. Go fill out your information and look in horror as you are identified. Most results narrow down to just one possible person.

Sample Identifiability


From the site's About page
This service reports how unique your demographics may be using Census data.

Birthdate (month, day and year of birth), gender, and 5-digit postal code (ZIP) uniquely identifies most people in the United States. Surprised? Perhaps at first, but then you do a quick calculation: 365 days in a year x 100 years x 2 genders = 73,000 unique combinations, and because most postal codes have fewer people, the surprise fades. Or, if you are still not convinced, there are more than 32,000 5-digit ZIP codes in the United States; so 73,000 x 32,000 is more than 2 billion possible combinations but there are only 310 million people in the United States. In 1997, Latanya Sweeney did this kind of uniform calculation on populations reported in the U.S. Census for age groups in each postal code and summed the results to predict that at most 87 percent of the U.S. population had unique combinations 
If you live in a remote location, you are easier to identify.
Notice that even knowing the county, age, and gender can make some people unique. They are few, and they tend to live in remote locations, but notice it is not 0.
Identifiability Graphs


The page goes on to explain the real problem, 87.1% of Americans are identifiable. Many marketers and other organizations share your information but protect privacy by concealing your name, address and social security number. Using publicly available information like a voter list and matching it with nameless private data such a medical records, privacy intruders can easily rebuild your identity data via demographics.

Medical data Plus Voter info equal names

Disguised as expanding Americans’ access to healthcare, a central database with all this information is being established. The Federal Data Services Hub is being assembled as part of ObamaCare’s insurance exchange implementation. Stephen T. Parente and Paul Howard report in USA Today:
By mid-December, the federal government is planning to quietly enact what could be the largest consolidation of personal data in the history of the republic. If you think identity theft is a problem now, wait until Uncle Sam serves up critical information on 300 million American citizens on a platter. ..

In order to determine eligibility for health insurance subsidies, the new exchange has to bring together information about you and your family from the Treasury Department and IRS, the Department of Homeland Security, the Department of Justice, as well as your Social Security number — all coordinated by the Department of Health and Human Services.

Additionally, there is no vetting process for those who will collect and control the medical information. There are no data privacy or fraud safeguards in ObamaCare (Patient Protection and Affordable Care Act) as it moves toward full implementation on Jan. 1, 2014. This is how the government and criminals will use the system to gather all of your private information.

Finally, consider that ObamaCare tax money is funding far left organizations. Nearly $200 million was secretly funneled to unions and far left groups in California alone as "outreach" for ObamaCare. These groups will collect and have access to all of your health information. As we see in the IRS scandal, they will use this power to rig elections and subvert our constitutionally protected civil rights.

The Civil Disobedience Solution

Now you know the problem, but all too often blogs and pundits fail to provide solutions. Not this time. 

In the 1960's a Republican named Martin Luther King Jr. reminded us: "One has a moral responsibility to disobey unjust laws." Today, we must echo this sentiment and begin using the 15th of every month as our birthdates with regard to ObamaCare, other medical and all marketing information. This will destroy any ability to individually target us through demographic information.

Conservative legislators should pass a law allowing individuals to report the 15th of their birth month as their birthday in all federal documents relating to medical information. Possibly, this could be amended to HIPAA (The Health Insurance Portability and Accountability Act of 1996). Maybe a brilliant law-maker has already added this to a law somewhere. If so, please add the information to the comments below.

Do not be concerned about existing information that you no longer control. This suggestion is for information within your control and can be applied to social networks immediately. Previously given information will be corrupted by future information. Privacy experts and computer professionals like myself will narrow down any additional "cross-checks" that are developed by Big Data collection.

This civil disobedience is a reflection of the simple truth that the freedom movement, the tea party, the 912 project and other groups are civil rights movements. It is time for us to take our place in history.

Friday, July 19, 2013

Twitter Bug Blew Up Android Phones

A recent Twitter for Android update may have been the cause of android phones heating up, batteries draining and some exploding in people's pockets.

As a techie, it is imperative to keep my technology up to date. As such, the latest Twitter for Android app seemed to have some great features which induced an immediate update on my phone.

Direct message sync, mobile search improvements and more
For all of these platforms, you’ll now be able to sync direct messages (DM) across all your devices and Twitter accounts. When you read a DM on your Android phone or iPhone, it will be marked as read in your browser, your desktop apps, or your tablet. And vice versa. Please note that syncing will roll out gradually: you’ll need to get the latest version of each app to ensure it works on all of your devices. 
More info on the Vine update.

After the Twitter for Android Update on July 8 my Android phone began heating up and the battery drained quickly. The logical assumption was that my lithium-ion battery had gone bad. However, the phone was getting so hot, I feared a battery explosion and began popping out the battery.

Removing the battery is something Apple iPhone users cannot do. Apple phones automatically turn off at a certain temperature. So, if this problem had occurred on an iPhone, my clients would not have been able to contact me. So, at least I was comforted in knowing that my aversion to iPhone worship allowed me to continue my business until a new battery could be purchased.

My assumption of a bad battery was thrown on its ear when my wife's Galaxy S III began running low on power and warming. We had not put the causality together, but in retrospect this also occurred after her Twitter for Android Update.

Regardless of the battery issue, I happened to be deciding between the new Galaxy S IV and a Galaxy S III phone upgrade. Maybe the "bad" battery was a biased excuse to get a better toy, but I began searching the Samsung Galaxy News. The following story caught my attention:

Melted Samsung Galaxy S III
Samsung Galaxy S III Explodes In User’s Pants, Burns Leg
An 18-year-old girl's Samsung Galaxy S III exploded in her pants when she was at work and what was once a usable phone became a mangled, warped slate of fire that severely burned her leg. It's insane to think that the phone you're either using right now (or maybe just put down 5 minutes ago), can become a burning a bomb. The girl whose phone exploded actually had to have her pants ripped off in order to prevent further injury.
And the burn was bad. Real bad. 
 Here is the result of the explosion to the woman's leg.

Woman's Legged Burned by Phone Explosion

OK, something was fishy.

The first thing I did was go into my Android Settings App and investigate what was draining all my power. The path About Phone > Battery Use normally shows Display takes about 85% of my battery life. At that time Twitter for Android was taking 60% and Display was 30%. YIKES!

Knee jerk Jedi style Force Stop was used on the Twitter app. The searching began for ways to reduce the app's power usage in its settings. Notifications for my account were turned off and in retrospect I should have turned off Sync Data. Sync Data was set to 30 minutes so it didn't seem to be a likely problem, but the phone heating was not fixed.

The battery drain began to affect my business. At one point, my phone remained charging in my car while an important work related call was missed. Luckily, the person making the call stumbled upon me in person and we had a discussion before tragedy struck.

Being a blogger, my inclination was to take my evidence and let the world know of the danger to their beloved Smart Phones. Being a Microsoft Certified Solution Developer (programmer) and Microsoft Silver Partner for Small Business here is what must have happened.

Twitter, in a rush to address complaints that Vine Twitter had more features than other Twitter apps, pushed a buggy update. The code must have contained an infinite loop. My assumption is that the loop was in the Sync Data code. This loop drained batteries and heated phones by running the devices processor at near maximum. Phones do not have CPU cooling fans so depending upon the situation, the battery may completely drain before anything dangerous occurs or the heating might boil the lithium-ion battery and cause a battery explosion.

On July 17th I checked the Google Play Store before blogging in order to be sure that the problem had not been addressed. The review led me to a new update in which Twitter fixed the problem.

Twitter for Android update brings in-line replies, sharing through direct messages.

Of course the public relations department spun the emergency update as "improvements." At least my phone has stopped heating up and my battery life is restored.  There will be no blogging war path for me, but the truth does matter and now you know.

Note

SLOBS author KT Cat published a story about Twerking using Storify.com and this was originally written there as a test, but the site stopped working and I can't log back on.

Wednesday, July 17, 2013

U.S. Treasury Commits Accounting Fraud To Create Budget Surplus

U.S. Treasury Debt

The U.S. Treasury has committed fraud in order to avoid the $16.7 trillion debt limit set by congress. Since May 15, 2013 the Treasury has borrowed at least $51 billion and reported no additional national debt.

Treasury Secretary Lew implemented a not-so “standard set of extraordinary measures” and wrote House Speaker John Boehner explaining the book cooking. Business Insider has the full letter posted. Lord Monckton explains the details in Outright Fraud at the U.S. Treasury:
That limit was – and is – $16.7 trillion. A trillion is a 1 with 12 noughts on the end. It is a million millions. It’s a whole lot. $16.7 trillion is 16.7 whole lots. You could buy most of my art collection with that.

But Obust just went on spending. By close of what passes for business May 17, the U.S. debt subject to congressional limit rose to $16,699,396,000,000.00. That is what passes for a smidgen below the limit.

But Obankrupt just went on spending. By close of what once passed for business July 12, he had borrowed another $51 billion.

Yet by close of casino July 12, according to the Treasury’s accounting, the U.S. debt subject to congressional limit had risen, compared with 56 days previously, by exactly $0,000,000,000,000.00.

What about the net $51 billion in extra borrowing over the past couple of months? Secretary Lew has vanished it.

If you think I’m foaming at the mouth, here is the Treasury’s own graph:

...

In the commercial sector, false accounting is a felony. Armies of overpaid, under-skilled regulators are waiting to pounce upon every cent that goes astray.

In the State sector, false accounting is also supposed to be a felony. Yet armies of overpaid, under-skilled Republicans are waiting to draw their next fat check out of the Treasury. As long as their checks keep coming, they will not – will not – ask the right questions and demand honest answers and straight accounting.

Corruption was once something that happened only in third-world countries. But then, the current administration’s wanton profligacy with other people’s money has reduced the United States to third-world status. Bankruptcy and corruption tend to go hand in hand.
Despite this information, financial news failed to put two and two together and reported the cooked books as a $117 billion budget surplus in June:
WASHINGTON (MarketWatch) - The U.S. federal government ran a budget surplus of $117 billion in June, the Treasury Department reported Thursday, as receipts rose and spending fell compared to the same month a year ago. For the fiscal year to date, the deficit is $510 billion, 44% less than the shortfall recorded in the same period last year, thanks mostly to increased revenue . The government's receipts totaled $287 billion in June, and spending was $170 billion. In June last year, the government posted a deficit of $60 billion. The government's fiscal year runs from October to September.

More Doo Doo Economics from the Obama Administration.
Doo Doo Economics

Tuesday, July 16, 2013

Dirty Old Mayor Bob Filner Awaits Costumed Comic-Con Girls

Cosplay Girls of Comic-Con

Cosplay Girls beware of San Diego Mayor Bob Filner.

San Diego wonders why the mayor refuses to step down amid widespread accusations of sexual harassment. Mayor Filner appointed Walt Ekard as Interim Chief Operating Officer for the city, but did not relinquish his title. The answer is obvious, his title is a "dirty old man" pick up line. Bob Filner is waiting to use the Mayor title to grope unsuspecting costumed women at San Diego Comic-Con 2013!

We write this jokingly, but with concern. Here is a video with the details of the sexual harassment accusations. Fellow SLOBS author W.C. Varones comments on the situation in Partisanship Over Perverts.

Bob Filner Joker Face
At Comic-Con, the "Dirty Old" Mayor may be in Joker make-up or wear a tall hat with the words "Mayor of Comic-Con" emblazoned. We don't believe he is aware of the "Free Hugz" craze, but maintain your distance.

Cosplay Women about to be Groped by Spiderman
Spiderman caught about to grope cosplay girls
Prior to becoming Mayor, Filner might have attended Comic-Con as Spiderman. This is based upon the web-shooting superhero's ability to capture victims in his web. The mask includes large eye covers to conceal his creepy staring. Lastly, the Spiderman's hand gesture can be used to say "come-hither" or grab a breast.

Chewbacca Demonstrates the Filner Dance
Here is an overview of the sexual harassment accusations. In public settings, Mayor Filner puts his arm around women's shoulders and leads them to a private area in a move known as the "Filner Headlock." He then attempts to kiss and stick his tongue in their mouths. The women avoid and move away. San Diego calls this the "Filner Dance." Then, Mayor Filner pulls the women even closer and on at least one occasion grabbed some breast. During these altercations he uses the line, "Just give me a kiss. You know that you love me."

Female lobbyists, campaign volunteers, city workers, charity organizers and ordinary citizens have been subjected to this behavior. Women trapped alone in his office have been seen leaving quickly and looking upset. His former fiance says that he would sext message women in front of her.

Groping Mayor Bob Filner
Dirty Old Mayor Bob Filner

Reminder

U-T San Diego: Filner Backs Convention-Stadium  Mayor also calls for creation of a 'Museum of Comic Books" that would keep Comic-Con in San Diego and attract 'zombie' tourists.
 “Those are on city lands,” the mayor said. “Imagine what we could do from a public perspective with that public space. Imagine what you could do for our community. That kind of stuff could finance things for the city.”
Now it all makes sense!

More Information

Thanks to Nick Popaditch for finding the Bob Finer Joker image.
Liberator Today declares Insanity In Our Back Yard - Filner Must Go in a summary on Filner.
Leslie Eastman writes San Diego Mayor Bob Filner Gives "Sequester" a Whole New Meaning

Monday, July 15, 2013

San Diego Mayor Bob Filner Sexual Harassment Details

San Diego Mayor Bob Filner Sexual Harassment Details

While we do not condone putting people on trial in the media, the current accusations against Mayor Bob Filner (D) are worth hearing. San Diego's Mayor is being portrayed as a "dirty old man" who sexually assaults women. One comment attributed to Mayor Filner, from a woman who kicked him out of her office for sexual harassment, "I'm the mayor. You can't kick me out of any office." (20 min mark in video).

It is worth noting that these accusation come from his former Democrat supporters. Only paid union supporters showed up to oppose the accusations.

This video is 30 minutes long. I recommend you fast forward to the 16 minute mark.
San Diego, California News Station - KFMB Channel 8 - cbs8.com
Full Transcript

Saturday, July 13, 2013

Not Guilty Verdict: "If I See Zimmerman" Tweets Trend (update)

President Obama and the main stream media turned the George Zimmerman trial into a racially motivated social justice prosecution. The ugly face of social justice was reflected in social media as #IfISeeZimmerman trended after the not guilty verdict was announced.

George Zimmerman Not Guilty

Jessie Jackson and others gathered for the trial due to the racial politics in the case. They were obviously disappointment by the verdict. Evidence against George Zimmerman was insufficient to charge the case, but it was pursued as part of the current social justice system. Equal justice cannot be served when politics and selective enforcement of the law is pursued from the highest levels of government.

Lets look at some of the tweets from twitter.


@ExtraordinaryH8 tweeted a mutilated male corpse with the man's genitals stuffed in his mouth.

#Riot4Trayvon Trends


See Twitchy for more tweets.

Twitter Update:

#noJustice, George Zimmerman, #TrayvonMartin, Florida,#JusticeForTrayvon and #RipTrayvonMartin are also trending on twitter. Celebrities have joined the tweets.


Violence in Oakland also marks this case as anarchist protesters take advantage of the opportunity to promote chaos and division.

President Obama's Department of Social Justice

As proof that justice is not being served by the Obama administration, President Obama and Eric Holder's Department of (Social) Justice will file federal charges against George Zimmerman for "violating Travon Martin's civil rights."  This aligns with the outrageous evidence that the DOJ facilitated anti-Zimmerman protests.
Department of Social Justice

Thursday, July 11, 2013

Bernanke and China Jawbone For Printing Money

Bernanke Printing Money and Gold Prices

Federal Reserve Chairman Ben S. Bernanke jawboned for maintaining accommodation just after the minutes of Fed policy makers’ June meeting showed debates on whether to stop bond buying by the Fed in 2013.

Jawboning is the economic policy tool of using speech to affect economic conditions by managing public expectations. The stock market has responded positively to the prospect that money continues to be printed and interest rates will remain low to prop up real estate. As the real estate and stock markets increase consumers feel more wealthy and tend to increase spending.

Market gains based on inflated dollars instead of wealth creation is the definition of a bubble. Recently,  stimulus withdrawal fears have led to major pull backs in the stock market. Benanke's jawboning is likely an attempt to erase these market declines by reducing skeptical investors' fears.

Also of note, gold prices have plummeted during early 2013. Reports point to central banks selling off large amounts of paper gold. The banks are now reportedly purchased physical gold at reduced prices. Today, gold prices are rising rapidly as China also announced it will "introduce supportive measures."
presumably because of the inverse relationship between the price of Gold, and the market perception of the value of paper currencies. So expectations of more QE is probably what has pushed up the price of Gold.
Bloomberg has more details here.
The Fed chairman spoke just three hours after the central bank released minutes of the June 18-19 gathering showing that about half of the 19 participants in the Federal Open Market Committee (TREFTOTL) wanted to halt $85 billion in monthly bond purchases by year end. At the same time, the minutes showed many Fed officials wanted to see more signs employment is improving before backing a trim to bond purchases known as quantitative easing.

hat tip Bloomberg

Additional Sources:

With few options, Fed turns to 'jawboning'

Friday, July 5, 2013

Doo Doo Jobs Report July 2013

In honor of the recent annual high point of economic activity known as July, let's look at the employment data just released by the Bureau of Labor Statistics.

For Job Seekers

Where is employment improving? (Data May 2012 to May 2013)

State:  Wyoming, 12 month net change:  -1.1State:  Wisconsin, 12 month net change:  0.0State:  Wisconsin, 12 month net change:  0.0State:  West Virginia, 12 month net change:  -1.4State:  Washington, 12 month net change:  -1.7State:  Washington, 12 month net change:  -1.7State:  Washington, 12 month net change:  -1.7State:  Washington, 12 month net change:  -1.7State:  Virginia, 12 month net change:  -0.2State:  Virginia, 12 month net change:  -0.2State:  Vermont, 12 month net change:  -0.5State:  Utah, 12 month net change:  -1.1State:  Texas, 12 month net change:  -0.3State:  Texas, 12 month net change:  -0.3State:  Tennessee, 12 month net change:  0.4State:  South Dakota, 12 month net change:  -0.4State:  South Carolina, 12 month net change:  -1.2State:  Rhode Island, 12 month net change:  -1.1State:  Rhode Island, 12 month net change:  -1.1State:  Rhode Island, 12 month net change:  -1.1State:  Pennsylvania, 12 month net change:  -0.3State:  Oregon, 12 month net change:  -0.8State:  Oklahoma, 12 month net change:  0.2State:  Ohio, 12 month net change:  0.1State:  North Dakota, 12 month net change:  0.1State:  North Carolina, 12 month net change:  -0.4State:  North Carolina, 12 month net change:  -0.4State:  New York, 12 month net change:  -1.0State:  New York, 12 month net change:  -1.0State:  New Mexico, 12 month net change:  -0.3State:  New Jersey, 12 month net change:  -0.6State:  New Hampshire, 12 month net change:  -0.2State:  Nevada, 12 month net change:  -2.0State:  Nebraska, 12 month net change:  0.0State:  Montana, 12 month net change:  -0.8State:  Missouri, 12 month net change:  0.0State:  Mississippi, 12 month net change:  0.1State:  Minnesota, 12 month net change:  -0.4State:  Michigan, 12 month net change:  -0.5State:  Michigan, 12 month net change:  -0.5State:  Michigan, 12 month net change:  -0.5State:  Michigan, 12 month net change:  -0.5State:  Michigan, 12 month net change:  -0.5State:  Massachusetts, 12 month net change:  0.3State:  Massachusetts, 12 month net change:  0.3State:  Massachusetts, 12 month net change:  0.3State:  Maryland, 12 month net change:  0.2State:  Maine, 12 month net change:  -0.5State:  Louisiana, 12 month net change:  0.5State:  Louisiana, 12 month net change:  0.5State:  Kentucky, 12 month net change:  0.2State:  Kansas, 12 month net change:  0.2State:  Iowa, 12 month net change:  -0.6State:  Indiana, 12 month net change:  0.0State:  Illinois, 12 month net change:  0.2State:  Idaho, 12 month net change:  -0.9State:  Hawaii, 12 month net change:  -1.4State:  Hawaii, 12 month net change:  -1.4State:  Hawaii, 12 month net change:  -1.4State:  Hawaii, 12 month net change:  -1.4State:  Hawaii, 12 month net change:  -1.4State:  Hawaii, 12 month net change:  -1.4State:  Hawaii, 12 month net change:  -1.4State:  Hawaii, 12 month net change:  -1.4State:  Georgia, 12 month net change:  -0.4State:  Florida, 12 month net change:  -1.6State:  Florida, 12 month net change:  -1.6State:  Florida, 12 month net change:  -1.6State:  Florida, 12 month net change:  -1.6State:  Florida, 12 month net change:  -1.6State:  Florida, 12 month net change:  -1.6State:  District of Columbia, 12 month net change:  -0.7State:  Delaware, 12 month net change:  0.2State:  Connecticut, 12 month net change:  -0.2State:  Colorado, 12 month net change:  -1.1State:  California, 12 month net change:  -2.2State:  California, 12 month net change:  -2.2State:  California, 12 month net change:  -2.2State:  California, 12 month net change:  -2.2State:  California, 12 month net change:  -2.2State:  Arkansas, 12 month net change:  0.2State:  Arizona, 12 month net change:  -0.8State:  Alaska, 12 month net change:  -0.9State:  Alaska, 12 month net change:  -0.9State:  Alaska, 12 month net change:  -0.9State:  Alaska, 12 month net change:  -0.9State:  Alaska, 12 month net change:  -0.9State:  Alaska, 12 month net change:  -0.9State:  Alaska, 12 month net change:  -0.9State:  Alaska, 12 month net change:  -0.9State:  Alaska, 12 month net change:  -0.9State:  Alaska, 12 month net change:  -0.9State:  Alaska, 12 month net change:  -0.9State:  Alaska, 12 month net change:  -0.9State:  Alaska, 12 month net change:  -0.9State:  Alaska, 12 month net change:  -0.9State:  Alaska, 12 month net change:  -0.9State:  Alaska, 12 month net change:  -0.9State:  Alaska, 12 month net change:  -0.9State:  Alaska, 12 month net change:  -0.9State:  Alaska, 12 month net change:  -0.9State:  Alaska, 12 month net change:  -0.9State:  Alaska, 12 month net change:  -0.9State:  Alaska, 12 month net change:  -0.9State:  Alaska, 12 month net change:  -0.9State:  Alaska, 12 month net change:  -0.9State:  Alaska, 12 month net change:  -0.9State:  Alaska, 12 month net change:  -0.9State:  Alaska, 12 month net change:  -0.9State:  Alaska, 12 month net change:  -0.9State:  Alaska, 12 month net change:  -0.9State:  Alaska, 12 month net change:  -0.9State:  Alaska, 12 month net change:  -0.9State:  Alaska, 12 month net change:  -0.9State:  Alaska, 12 month net change:  -0.9State:  Alaska, 12 month net change:  -0.9State:  Alaska, 12 month net change:  -0.9State:  Alaska, 12 month net change:  -0.9State:  Alaska, 12 month net change:  -0.9State:  Alaska, 12 month net change:  -0.9State:  Alaska, 12 month net change:  -0.9State:  Alaska, 12 month net change:  -0.9State:  Alaska, 12 month net change:  -0.9State:  Alaska, 12 month net change:  -0.9State:  Alaska, 12 month net change:  -0.9State:  Alaska, 12 month net change:  -0.9State:  Alaska, 12 month net change:  -0.9State:  Alaska, 12 month net change:  -0.9State:  Alaska, 12 month net change:  -0.9State:  Alaska, 12 month net change:  -0.9State:  Alaska, 12 month net change:  -0.9State:  Alaska, 12 month net change:  -0.9State:  Alaska, 12 month net change:  -0.9State:  Alaska, 12 month net change:  -0.9State:  Alaska, 12 month net change:  -0.9State:  Alaska, 12 month net change:  -0.9State:  Alaska, 12 month net change:  -0.9State:  Alaska, 12 month net change:  -0.9State:  Alabama, 12 month net change:  -0.8

When you place your cursor on a State, its name will appear along with the statistic for that State. If you click on a State, you will then see the corresponding county map for that State.

Map Title: 12-month change in unemployment rates by State, not seasonally adjusted
Map Type:  state Map
Month/Year: May/2013

State May
2012
May
2013
12-month net change
Alabama 7.1 6.3 -0.8
Alaska 6.9 6.0 -0.9
Arizona 8.2 7.4 -0.8
Arkansas 7.1 7.3 0.2
California 10.3 8.1 -2.2
Colorado 7.9 6.8 -1.1
Connecticut 8.3 8.1 -0.2
Delaware 6.7 6.9 0.2
District of Columbia 9.0 8.3 -0.7
Florida 8.6 7.0 -1.6
Georgia 8.9 8.5 -0.4
Hawaii 5.9 4.5 -1.4
Idaho 6.8 5.9 -0.9
Illinois 8.5 8.7 0.2
Indiana 8.1 8.1 0.0
Iowa 4.9 4.3 -0.6
Kansas 5.6 5.8 0.2
Kentucky 8.1 8.3 0.2
Louisiana 6.5 7.0 0.5
Maine 7.3 6.8 -0.5
Maryland 6.7 6.9 0.2
Massachusetts 6.5 6.8 0.3
Michigan 8.9 8.4 -0.5
Minnesota 5.3 4.9 -0.4
Mississippi 9.1 9.2 0.1
Missouri 6.7 6.7 0.0
Montana 5.7 4.9 -0.8
Nebraska 3.8 3.8 0.0
Nevada 11.2 9.2 -2.0
New Hampshire 5.3 5.1 -0.2
New Jersey 9.3 8.7 -0.6
New Mexico 6.7 6.4 -0.3
New York 8.4 7.4 -1.0
North Carolina 9.3 8.9 -0.4
North Dakota 2.7 2.8 0.1
Ohio 6.8 6.9 0.1
Oklahoma 5.1 5.3 0.2
Oregon 8.4 7.6 -0.8
Pennsylvania 7.7 7.4 -0.3
Rhode Island 10.3 9.2 -1.1
South Carolina 9.0 7.8 -1.2
South Dakota 4.2 3.8 -0.4
Tennessee 7.9 8.3 0.4
Texas 6.8 6.5 -0.3
Utah 5.7 4.6 -1.1
Vermont 4.7 4.2 -0.5
Virginia 5.8 5.6 -0.2
Washington 8.3 6.6 -1.7
West Virginia 7.3 5.9 -1.4
Wisconsin 6.7 6.7 0.0
Wyoming 5.3 4.2 -1.1


Sector Performance

Job growth has been slow with only 195,000 nonfarm payroll jobs added in June. The National unemployment rate remained at 7.6%, but underemployment jumped mainly due to seasonal influences. Generally the economy is going sideways. Lets look at some of the important sectors of the economy.
June 2013 Total Private Sector Employment


The Leisure and Hospitality sector accounts for a third of the June jobs. Most of those jobs are in "food services and drinking places." Good news for entry level employees and immigrants affected by the new amnesty bill before the U.S. Congress.
Leisure and Hospitality June Employment


Retail trade was another area of job growth, along with health care, financial activities and business and professional services. America's future increasingly depends on gains in the mining sector.

Total Mining Sector Employment

Oil Mining Sector Employment June 2013
Specifically, we point to oil and gas mining as a key area of strength at this time.

Some sectors of the economy are suffering. Construction and manufacturing have not recovered significantly since the Democrat Congress of 2007 pushed the economy over the cliff.
June 2013 Construction Sector Employment

Manufacturing June 2013 Employment

Employment Details

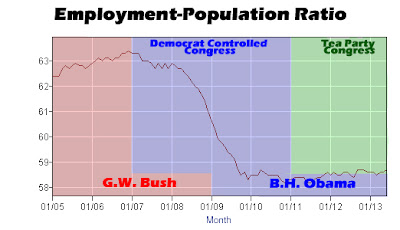
President Obama has failing numbers in Employment-Population Ratio. The number of people employed as a percentage of the U.S. Population has fallen and it can't get up. While the number for June 2013 rose .1%, the average for the year is the same as the average of 2012. There has been no improvement since the number fell drastically beginning in January 2007. As Democrats took control of the U.S. Congress in 2007 the number began to plummet from 63.3% to the current 58.6%.
Employment-Population Ratio June 2013
To add to the economic injury, the civilian labor force is really taking a beating under the Obama administration. Between ObamaCare and executive branch over-reach, even the Tea Party Congress has has not been able to instill confidence in the civilian labor force.
Civilian Labor Force Participation June 2013

Immigration

Another employment factoid is "Immigrants account for all job gains since 2000: native-born workers’ employment has fallen" per the Washington Times.
The Center for Immigration Studies report, which is being released Wednesday, says 22.4 million immigrants (both legal and illegal) of working age held jobs at the beginning of this year, up 5.3 million over the total in 2000. But native-born workers with jobs dropped 1.3 million over that same period, from 114.8 million to 113.5 million.
When we consider that many of the growing economic sectors are lower-wage, this immigration (both legal and illegal) factoid might account for some of the spiraling civilian labor force participation. If illegal immigrants are taking jobs they are likely "under the table" and not counted in official reports.

Conclusions

The U.S. economy is shaky at best. It seems unlikely that interest rates will spike for the foreseeable future. Until all the uncertainty surrounding the current administration clears, it is hard to imagine a full recovery.

There are a couple other interesting pieces of employment data on the BLS.GOV:

ShareThis

Ads

LinkWithin

Related Posts Plugin for WordPress, Blogger...